Mosquitto
MQTT broker for sensor traffic and generated room data.
Port: 1883
Feature Map
The repository spans browser UIs, message transport, collectors, simulation tools, and documentation. This page condenses those pieces into the parts a new contributor needs first.
MQTT broker for sensor traffic and generated room data.
Port: 1883
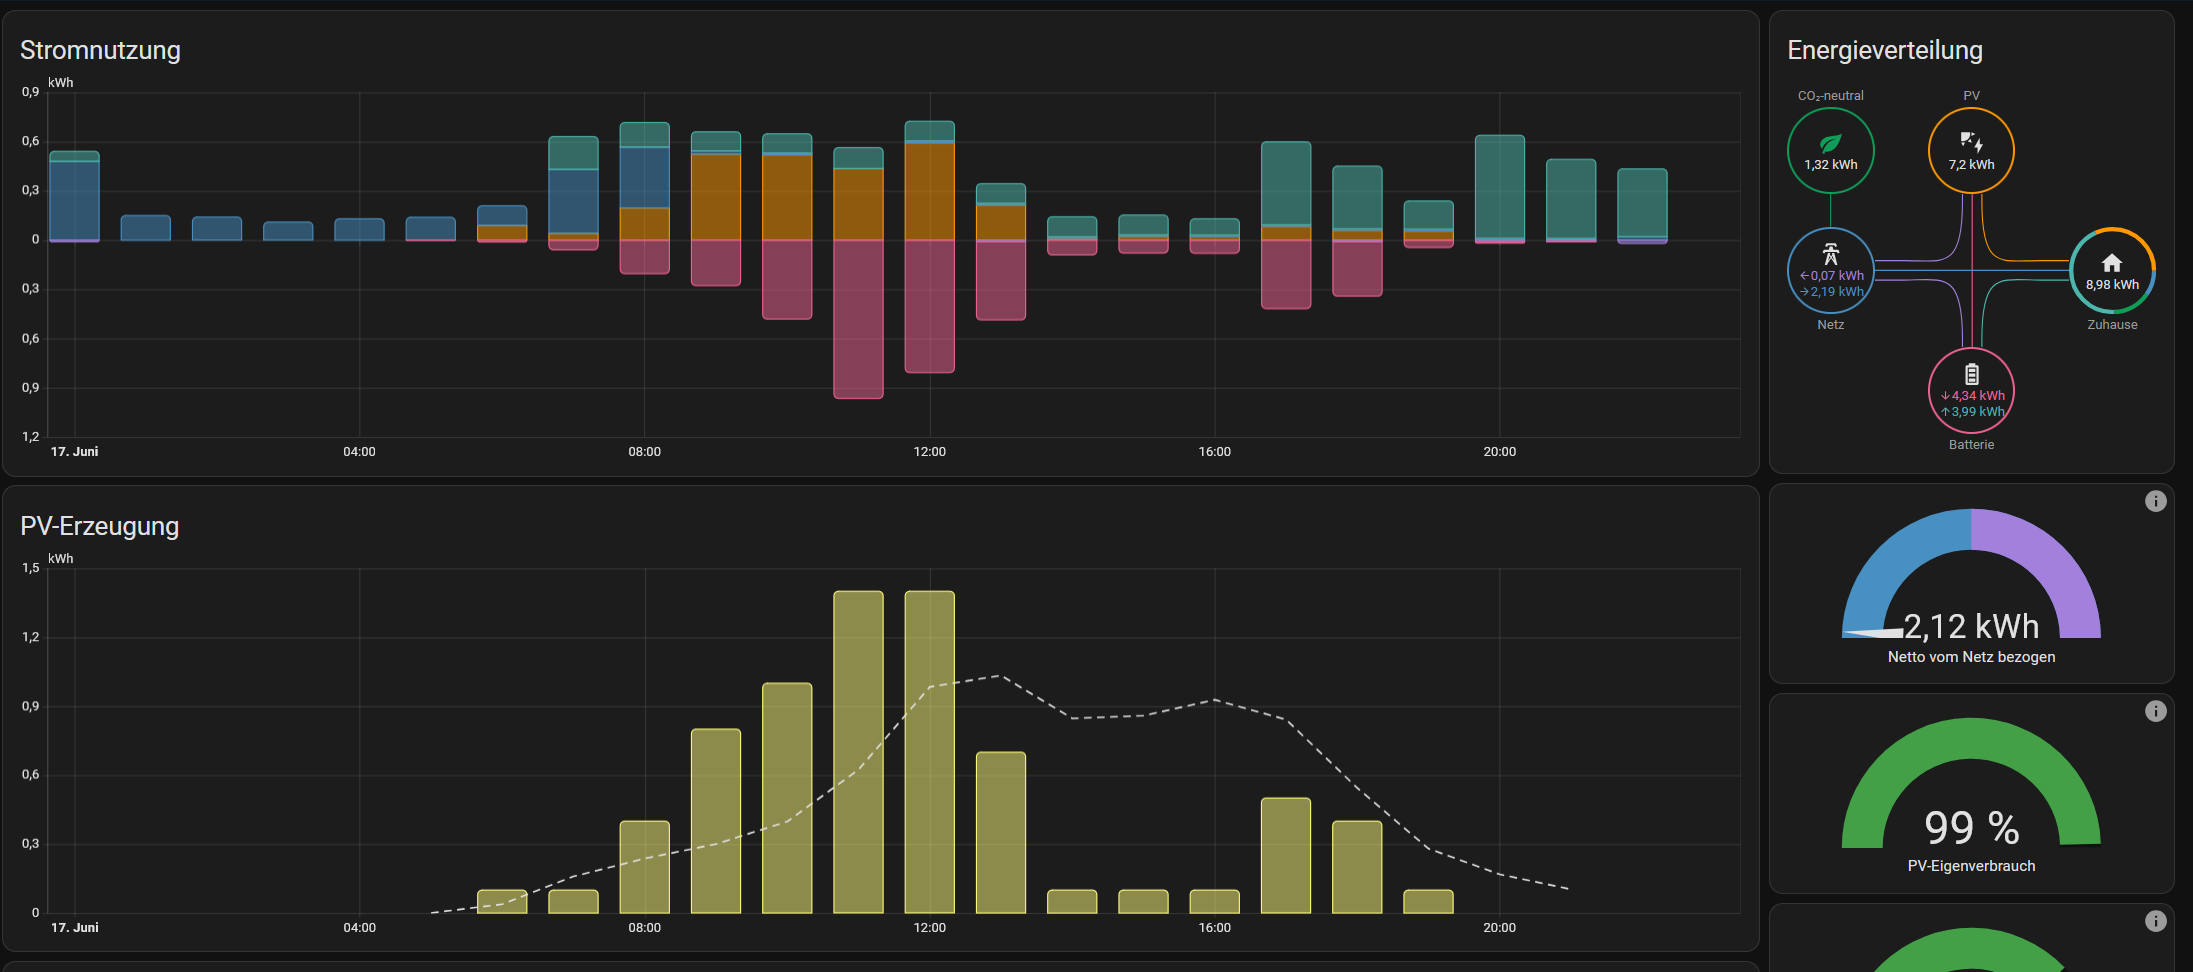
Time-series storage for room climate and energy telemetry.
Port: 8086
Subscription and write pipeline from MQTT into InfluxDB.
Port: -
Operational dashboards for analytics and history.
Port: 3000
Three.js building view for room temperatures.
Port: 8080
Live room dashboard for charts and sensor cards.
Port: 8081
Pushes temperature and CO2 updates to browser subscribers.
Port: 8090
Publishes sine data and room temperatures on a schedule.
Port: -
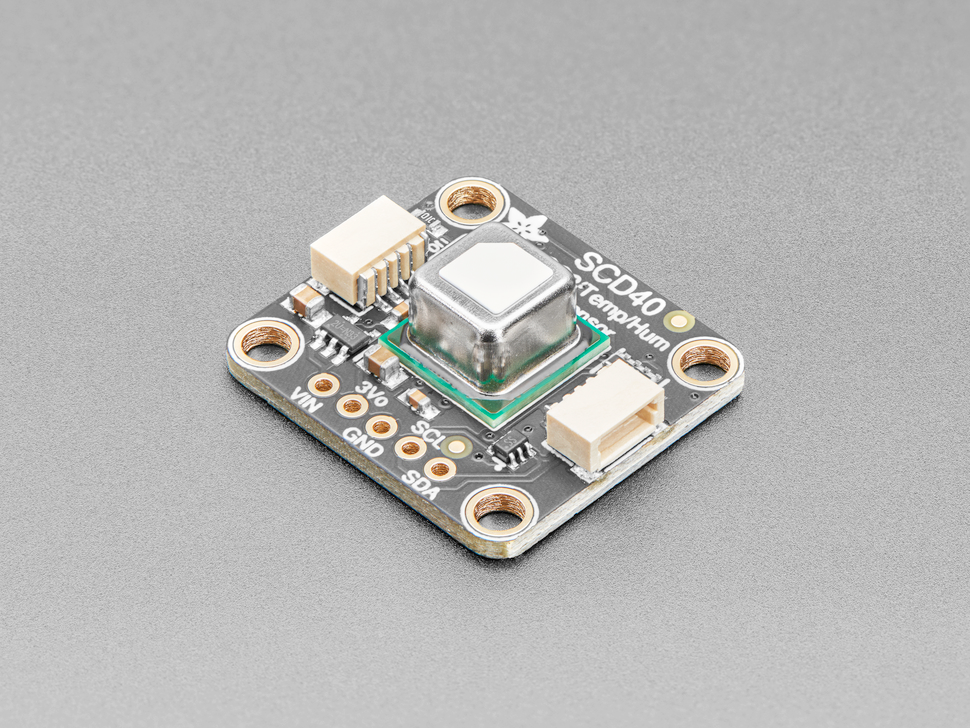
Simulates realistic room occupancy, temperature, and CO2 values.
Port: -
Pulls PV plant data from Solax Cloud and writes it to InfluxDB.
Port: -
Simulation
The `fake-sensors` package publishes realistic temperature and CO2 values for multiple classrooms, including occupancy-driven changes during school hours.
Live UI
The Three.js frontend focuses on the spatial building view, while `dashboard-v2` provides a more conventional monitoring dashboard for readings and trends.